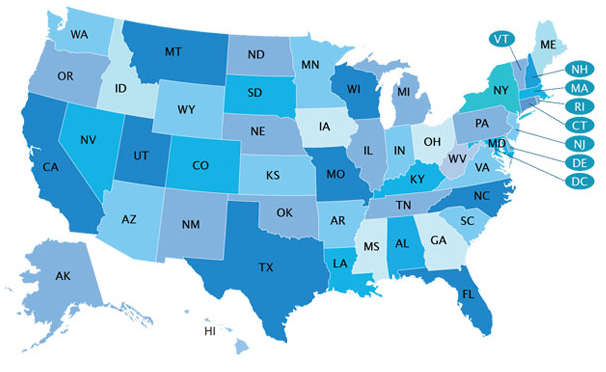
 From the heritage site:
With each vote cast in Congress, freedom either advances or recedes. Heritage Action’s new legislative scorecard allows Americans to see whether their Members of Congress are fighting for freedom, opportunity, prosperity, and civil society. The scorecard is comprehensive, covering the full spectrum of conservatism, and includes legislative action on issues both large and small.
Heritage Action’s legislative scorecard isn’t graded on a curve – it is tough and we don’t apologize. After all, we are conservatives, not tenured university professors.
| 3 | Rep. Justin Amash | R | 89.00% | |
| 1 | Rep. Dan Benishek | R | 81.00% | |
| 4 | Rep. Dave Camp | R | 57.00% | |
| 14 | Rep. John Conyers Jr. | D | 11.00% | |
| 13 | Rep. Hansen Clarke | D | 13.00% | |
| 15 | Rep. John Dingell | D | 4.00% | |
| 2 | Rep. Bill Huizenga | R | 83.00% | |
| 5 | Rep. Dale Kildee | D | 6.00% | |
| 12 | Rep. Sander Levin | D | 10.00% | |
| 11 | Rep. Thaddeus McCotter | R | 68.00% | |
| 10 | Rep. Candice Miller | R | 59.00% | |
| 9 | Rep. Gary Peters | D | 14.00% | |
| 8 | Rep. Mike Rogers | R | 58.00% | |
| 6 | Rep. Fred Upton | R | 48.00% | |
| 7 | Rep. Tim Walberg | R | 79.00% | |
| MI | Sen. Carl Levin | D | 5.00% | |
| MI | Sen. Debbie Stabenow | D | 0.00% |